Saturday, March 31, 2007

ETF Update for Monday April 2

The 240 min. chart of IWM, iShares Russell 2000 index, is very interesting. We have come down from the uptrend line resistance which just happened to be where the .76 fib. level was. Now we are at daily, 240, and 60 min. support. It looks to me that we are setting up for another move up, but I am also aware of the resistance. I need to see more price deterioration to start thinking short.

The 60 min. chart of IWM shows the pullback to the 200 moving average support and the .38 fib. support level. If price can get above the trend line and the moving averages cross up I would look to go long some where around 79.79 with a profit target of 82.45.

In my previous post, I suggested going long SPY on a break of the downtrend line at support here. Price did break the trend line, but shot back down on the news about trade with China. I personally did not make the trade because I was not at my computer for most of the day, if I did take the trade, I probably would have been stopped out. It was a very volatile day that was hard to peg where price was heading.


Still long EEM, still acting o.k., stop loss is at 113.39.


Thursday, March 29, 2007

ETF update for Friday March 30

SPY 60 min. chart shows a double bottom at daily moving average support. Would go long on a break of downtrend line around 142.47.

SPY has pulled back to moving average support and is in better shape then the Dow and Nasdaq. The downtrend line could hold price back on any advance and the stochastics are rolling over from overbought.

EEM, iShares Emrg. Mkts. Index, pulled back to moving average support, see next chart for trade execution.


Went long EEM at 116.47, stop loss is under support at 113.39(red line). The trigger was the break of downtrend line and moving average cross.


Stopped out of GLD for a .37 loss.


ETF Update for March 29

IWM, iShares Russell 2000 index, is right at support on the daily, 240 min. and 60 min. charts. Looking to go long around 79.90

Stopped out of SPY at 141.91 for a loss of $1.61. I did follow my trading plan of buying a pullback to support, price did not move higher and I was stopped out at my predetermined stop loss. On to the next trade.

Tuesday, March 27, 2007

ETF update for Wednesday March 28

On the index ETF's, price is being pinched between moving average support and the downtrend line that I have put on the chart. I would go long above the trend line and short on a breakdown under moving average support. The 60 min. charts look a little shaky, but the 240 min. charts still hold good support areas.

Still long GLD from 65.74, price is still above moving average support.


Still long SPY from 143.52, price has come down a little, still o.k. until price goes below 141.60.


Monday, March 26, 2007

ETF update for Tuesday March 27

SPY - Did pullback to it's daily moving average support, which all the index ETF's did. Went long at 143.52, the trigger was a moving average crossover on the 15 min. chart.

GLD - Streetracks Gold, did pullback to moving average support around 65, which triggered a long(see next chart).

GLD -Streetracks Gold, trend did turn bullish on 60 min. chart. Went long at 65.71-74, a little before the price I highlighted in my prevous post. My initial stop loss is at 64.88, which is below support.


FXI - The daily chart shows that the moving averages have crossed up and price has moved through the down trend line, unfortunatly I was stopped out of my position(see next chart).


The 60 min. chart shows my entry and exit. I exited my position before my stop loss was hit Monday morning. Everything was selling off hard and I made a decision to get out while I still had a small loss. As it tuned out was maybe a mistake, but one I can live with. My loss was $1.43 and the first one since I started this blog on February 15th.


Friday, March 23, 2007

ETF Update for Monday March 26

GLD, Streettracks Gold index, did pullback to moving average support around 65. Looking for a long trigger on the 60 min. chart to go long.

The 60 min. chart of GLD shows the pullback. A move up through the downtrend line around 65.90 would have the moving averages turned up and would be a good entry point.
Most all index ETF's are extended on the long side, I am waiting for pullbacks for entries. I will post them here when or if that does happen.

Thursday, March 22, 2007

ETF update for Friday March 23

GLD, StreetTracks Gold Index, has turned bullish form the bounce off it's up trend line. Waiting for a pullback to around 65 for a long entry.

EPP, iShares Pacific index ex-japan, is near resistance at 134.82. Nothing specific to do right now, watching to see if price is going to breakdown for a possible short.

Wednesday, March 21, 2007

ETF update for Thursday March 22

QQQQ did lead the other index's through their 50 day moving average resistance(see yesterday's post). Very impressive day, hard to hold off from buying, but I did sit on my hands when it came to the index ETF's. My strategy is is to buy pullbacks in up trends, and to sell rallies in downtrends. Right now we are between the two, I will be waiting for the right time to enter a trade.

DIA - The moving averages have not turned bullish, but through resistance, I have a neutral bias right now.

SPY - The moving averages have not turned bullish, but have gone through resistance. I'm in a wait and see mode here, the next several days should hold some clues.


FXI, iShares Xinhua China 25, never did breakdown(see yesterday's post) so I did not make a short trade. I did take a small long position when price broke through the downtrend line(see chart). The moving averages have not turned bullish, so I did not go full strength on my long. I will be waiting to see if we can go higher here then pullback to support, that's where I would be putting the big money to work.


ETF update for Wednesday March 20

FXI, China index ETF, is right at 50 EMA(purple) resistance, I will be looking to go short on any breakdown from here.

QQQQ has made it to it's 50 EMA resistance, while DIA and SPY have not made it to their 50 EMA's. It will be interesting Wednesday to see if QQQQ will start to lead the other index's down, or breakthrough to lead the other index ETF's higher.

Monday, March 19, 2007

ETF update for Tuesday 3/20

SLV, ishares silver trust, is right at it's 20 EMA(red) and 50 EMA(purple) resistance. Notice also that price is right at the uptrend line line which is now acting as resistance. Looking to go short on a breakdown around 129.83.

FXI, china index ETF, has made it up to it's next to highest resistance level. The straight line resistance(red line) is where we are at now, the 50 EMA(purple) is the next resistance level. I will go short on a breakdown from here around 97.84.

All US and foreign index ETF's rallied Monday. Most are up to their first or second level resistance. I am not going long on this rally, volume has been light on the up days and heavy on the down days. My game plan is to let the market suck more longs in and see what happens when we hit the higher resistance levels. I am expecting the markets to make another leg down at that time, that's where the big money will be made.

Sunday, March 18, 2007

ETF analysis for Monday 3/19

The daily chart of EEM has price up to it's 50 EMA resistance. A very nice place to look short. My plan is to short 1/2 near current levels and 1/2 on a break of the up trend line. EPP and ILF have the same type of price action as EEM, so my game plan is the same for those.

The 60 min. chart of EEM shows the trend line and how we are at the 200 EMA(green) resistance.

On the weekend I like to get a big picture look at what's going on, so I have included weekly charts of the index ETF's. The weekly chart of SPY has price bouncing off the .38 fib. retracement Notice how price has bounced off the 8 EMA(black) and 13 EMA(blue), now acting as resistance. The stochastic and MACD are in rollover mode. I think we have a date with the 50 EMA(purple) or .50 fib. retracement at 134.20 in the near future.


The daily chart of SPY has price between support and resistance. The EMA's are sharply turned down, any rally up to them are shorting opportunities.


The weekly chart of QQQQ shows how we have bounced down from trend line resistance and now sitting above support at its 50 EMA(purple) and 200 EMA(green). The daily EMA's are no where close to rolling over yet.


The daily chart of QQQQ has price at the 8 EMA(black) and 13 EMA(blue) resistance and above it's support(blue). Like the other ETF's, I'm looking for a rally higher to short.


The weekly chart of DIA has price holding at the .38 fib retracement. Notice how price has gone right up to the 8/13 EMA, now acting like resistance. I think we have a date with the weekly 50 EMA(purple) at 118.58 or even the .50 fib retracement at 117.43.


DIA daily chart has off it's 8 EMA(black) and above it's support levels(blue). My plan of action is to wait for a rally into the 13 EMA(blue), 21(red), 50(purple) and straight line resistance(red line) for short entries. I will also go long if price goes to support(blue) and gives me a long trigger. If that happens, the EMA resistance would be the profit target.


Thursday, March 15, 2007

ETF update for Friday 3/16

SPY has bounced off it's support(blue) and is at it's first resistance level(red). According to the big arrow we are heading lower, could be the first resistance level or the next three. I would be looking to go short on a short trigger here, but Friday is quadruple witching and there will be a lot of volatility. I prefer not to trade then, so Friday will be a day off for me and after tomorrow I will take a look at what we have for Monday.

QQQQ is at resistance, a possible double bottom has formed, will need to see more constructive price action to think about going long. I am only thinking short here.

DIA has bounced off it's support(blue) and is at it's first resistance(red) level. We could get a rally to the next couple of resistance levels, so I would only short here on a clear breakdown.


EPP - Pacific ex japan ETF, has an interesting looking chart. We are at daily EMA resistance and should go lower, see next chart for specific entry zones.


The 60 min. chart of EPP shows an inverse H & S forming. The way I'm going to play this is to go long on a break of the neckline and since we are at daily resistance, I will go short on a break of the uptrend line.


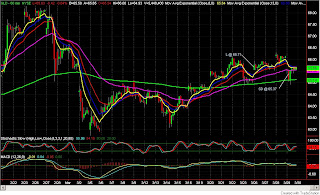
GLD bounced off it's uptrend line. I would not be to excited to go long here, I would like to see price at least go through it's daily EMA resistance. On the short side, I would take a short position on a break of the trend line around 63.07.


The daily chart of EEM shows that we are at EMA resistance(red) and would be looking for prices to go lower.


The 60 min. chart of EEM shows a triangle formation. I would not go long on the break higher just because of the resistance above it. I will go short on a break of the uptrend line since we are at resistance levels and price should accelerate on a break through.


Wednesday, March 14, 2007

A look at the ETF's for Wednesday 3/14

GLD - STREETTRACKS GOLD, is bouncing off it's major uptrend line. I am keeping an eye on it. If we can get above it's daily EMA resistance I will be looking to go long.

SPY - Price bounced hard off support(blue) which I identified on my post yesterday. I am not going to go long here, the higher probability trade is waiting until we get to resistance levels(red) and then get short again.

Covered my short at 137.36 which was my first profit target(see yesterday's post) for a profit of $2.36. Price reversed hard at support on heavy volume.


On the daily chart of QQQQ you can see we bounced off support(blue) and are heading to resistance(red).


Covered my short near my target at 42.17(see yesterday's post). The target was the daily 200 EMA support and straight line support.


DIA - Price bounced off support(blue line) and is heading toward resistance(red lines). I put a big down arrow on the chart to just remind everyone where we are heading. All the daily EMA's are pointing down, that's how I am playing the game right now. Wait for a rally, then short.