Monday, April 16, 2007

ETF update for Tuesday April 17

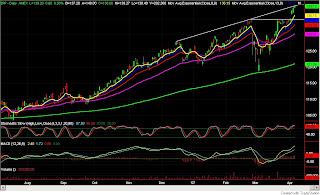
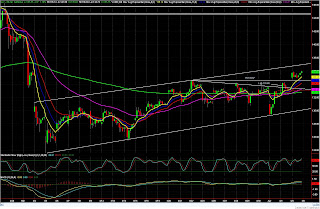
SPY has broken above it's previous high, QQQQ and DIA have not reached their previous highs. IWM is close to it's previous high. I am patiently waiting for a pullback. I am also surprised by the length of this latest upswing in the index and foreign ETF's. Pullbacks will come eventually.
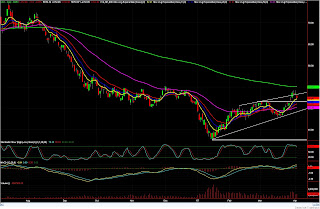
EEM - Price has reached the trend line that was support, could be a resistance now.

Still long USO, moved my stop loss down to 50.44. If trend line support gives, I will switch from bull to bear and go short. A break of support would be around 50.26.

Saturday, April 14, 2007

ETF update for Monday April 16

All index ETF's, gold, and silver are extended on the long side, I'm waiting for pullbacks to support for long entries. When we start to get a pullback, I will highlight the areas of support.
Still long USO, stop loss 50.66.

Thursday, April 12, 2007

ETF update for Friday April 13

Today we got a snap back move in the index ETF's. The index ETF's did hit the support areas that I mentioned in my post yesterday. I did not expect them to go straight up. I was expecting some stabilizing first before we went up. I did not go long on the index ETF's, I missed my long triggers by a hair. I am going to wait and see what happens tomorrow before I make any trades.
As I mentioned in my post yesterday, USO was in the support zone and was setting up for a long. Today I went long at 51.64, the trigger was 8/21 moving average cross. My stop loss is at 50.66, looking for a move to 54.

The support zone on USO on a daily chart. The support consists of the daily 50 moving average support and trend line support.

Wednesday, April 11, 2007

ETF update for Thursday April 12

As I stated in my previous post, I said a downturn was over due. Today we got a pullback, I still think we have some more downside to go. Bottom line, price on a few ETF's which I highlight below have pulled back to first level support zones. At this point we must still be thinking long as the trend is still positive on the 240 min. and daily charts of most index ETF's
QQQQ has pulled back to it's daily 13 day moving average support and the .38 fib support from the March 30 low. I think price has further downside, but will be watching to see if price can stabilize here.

DIA has pulled back far enough to take a look at. This is a 60 min. chart showing price at the .38 fib. support. I would like to see a further pullback to the 200 moving average support around 124, which would coincide with daily 50 moving average support. If we get a trend change to bullish on the 60 min. chart tommorrow, I will look to go long, but my feeling is that we have further downside to go.

USO, United States Oil Fund, is testing the bottom of the up channel in the chart above. It's not close to setting up for me to go long yet, but I'm keeping an eye on it.


Tuesday, April 10, 2007

ETF update for Wednesday April 11

What can I say, the markets are going up forever and never coming down again. I think the Dow is up 7 or 8 days in a row, the last time it did that was 4 years ago. A regression to the mean, ie. downturn, will come, sooner than later, markets can defy gravity for just so long. Nothing much to outline tonight, have patience and wait for that pullback that will come eventually. Now is the time to stick to your discipline.

Monday, April 9, 2007

ETF update for Tuesday April 10

All index ETF's are overbought and need to pullback for any entries. I will post any setups if and when they occur. Right now, for me, its time to sit on my hands and wait for opportunities.
Sold SLV at 136.78 for a $2.98 gain. Price hit my target at the top of the channel around 137 and I sold out. I will be watching for a pullback in which to reenter.

Sold EEM at close on Monday at 120.91 for a $4.44 gain. I usually sell something when it hits a resistance level or takes out a trailing stop. I sold this position because indicators are very overbought and a downturn should be coming soon. I am a trader and my mission is to buy weakness in up trends and sell when price peaks.

Saturday, April 7, 2007

ETF Update for Monday April 9

In this post I will point out the possible resistance areas of ETF's. I am not looking for entries at this point, everything is way overbought and does not offer a positive reward/risk. I am not looking for shorts at this point, just areas of resistance to take profits and observe price action. I am still long SLV, and EEM. SLV is near my price target of 137, EEM is beyond my price target and will sell below support at 119.50. IWM, iShares Russell 2000 index ETF, 240 min. chart showing price at .76 fib resistance and a possible double top. If price does go higher from here, it must contend with the trendline resistance just above where price is at now.

QQQQ - 240 min. chart showing resistance trendline.

DIA - 240 min. chart shows price close to .76 fib. resistance.


EPP, iShares MSCI Pac Index ETF, is right at trendline resistance.


Wednesday, April 4, 2007

ETF update for Thursday April 5

Still long SLV, had a nice move today, this is a very volatile ETF, so my stop loss is at 133.08. The next resistance is at the top of the up channel around 137, that is my profit target.

Everything is very over extended right now, I am going to wait for pullbacks before initiating any new positions.

Still long EEM, price is just above resistance at 119.58. I moved my stop loss up to 119.27.

Tuesday, April 3, 2007

ETF update for Wednesday April 4

USO, United States oil fund ETF, has pulled back to it's 8 period moving average. Will be looking for an entry around 53.

Went long SLV at 133.80 on break of wedge from daily 200 moving average support. Stop loss is at 131.93.

Still long EEM from 116.47. Price hit resistance around 119.36, looking to sell tomorrow if price stalls at current levels.


Monday, April 2, 2007

ETF update for Tuesday April 3

I put up a 240 min. chart of DIA to show a wedge pattern that is forming. We are in a congestion area right now on the ETF index's. I don't have a real opinion on the direction of the market right now, it's in a show me a direction phase right now. I will be going long on a breakout to the upside of the wedge and short below. Most foreign index's are near or at back to their highs for the year. Will they stall and reverse at resistance? Or breakthrough and send our index's high? I will be watching the foreign index's closely.

QQQQ 240 min. chart showing a wedge.

240 min. chart of SPY showing the wedge.


SLV, iShares Silver Trust, is bouncing of it's daily 200 moving average support at 130. Other daily moving averages are neutral. On the 60 min chart above, I have put two trendlines on that show a wedge pattern forming. A break of the trendlind would trigger a long around 133.86.


Still long EEM from 116.47. Stop loss at 115.19, target is 119.38.