ETF Update for Monday April 9
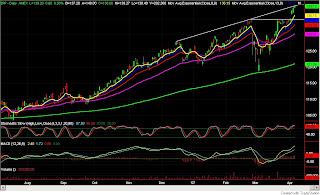
In this post I will point out the possible resistance areas of ETF's. I am not looking for entries at this point, everything is way overbought and does not offer a positive reward/risk. I am not looking for shorts at this point, just areas of resistance to take profits and observe price action. I am still long SLV, and EEM. SLV is near my price target of 137, EEM is beyond my price target and will sell below support at 119.50. IWM, iShares Russell 2000 index ETF, 240 min. chart showing price at .76 fib resistance and a possible double top. If price does go higher from here, it must contend with the trendline resistance just above where price is at now.


No comments:
Post a Comment